Finding A Directional Bias Manually
Although this strategy can be traded on any time frame, I prefer to trade the strategy on weekly period.
Each trade can be analyzed over the weekends, while the markets are closed.
This allows plenty of time to analyze all 28 pairs and set pending orders before the market reopens Sunday nights.
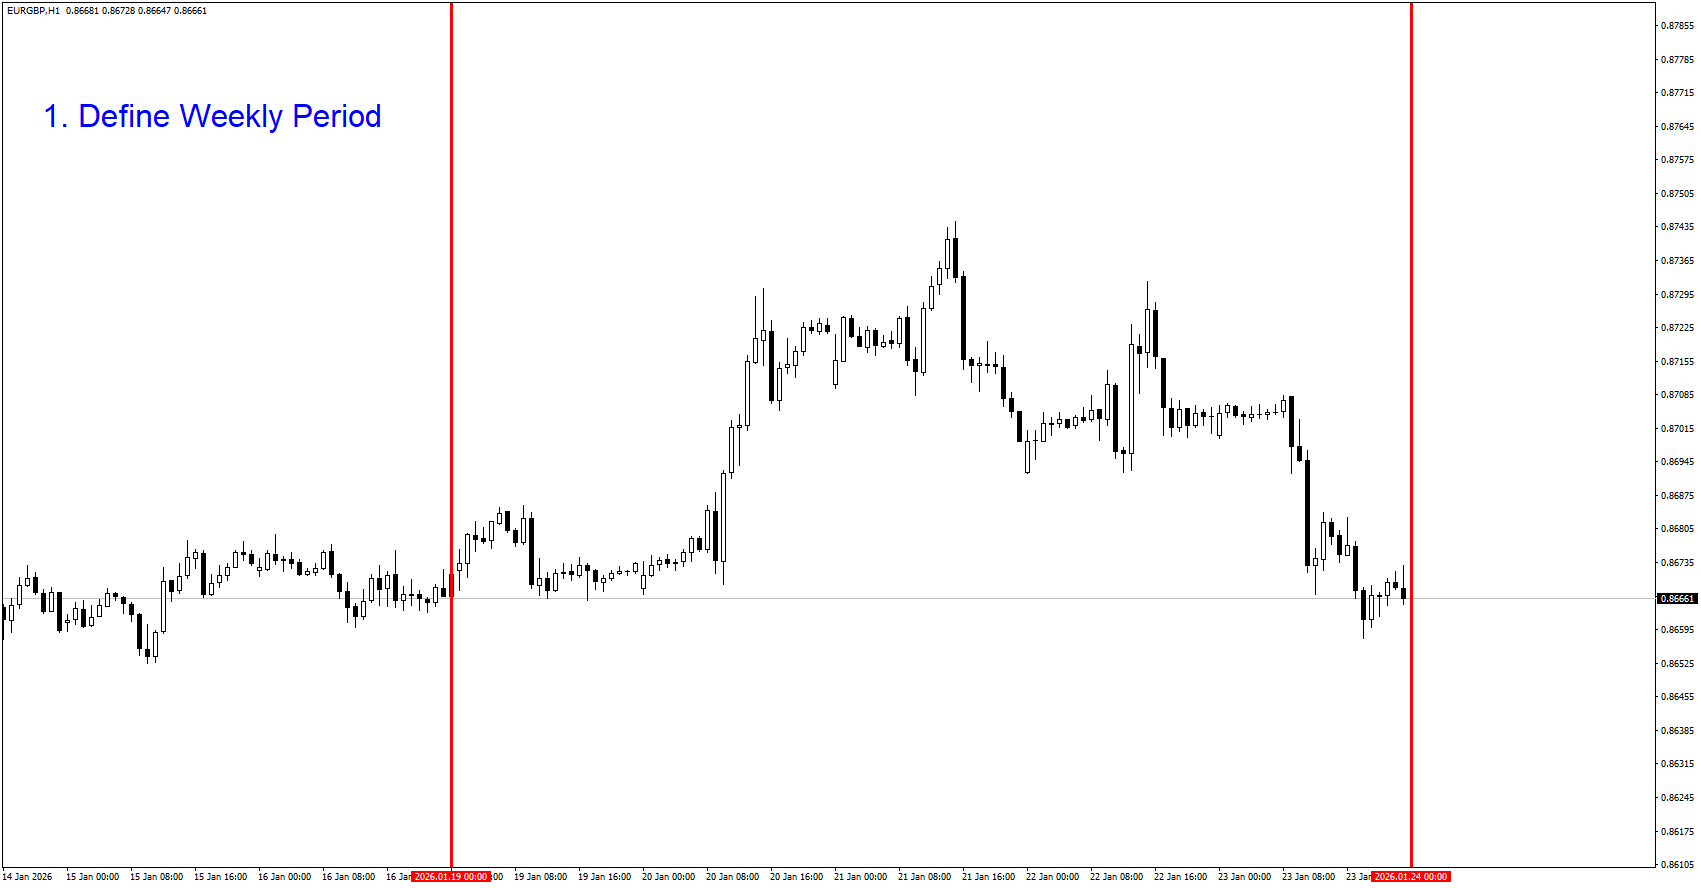
Step 1: Define Weekly Period
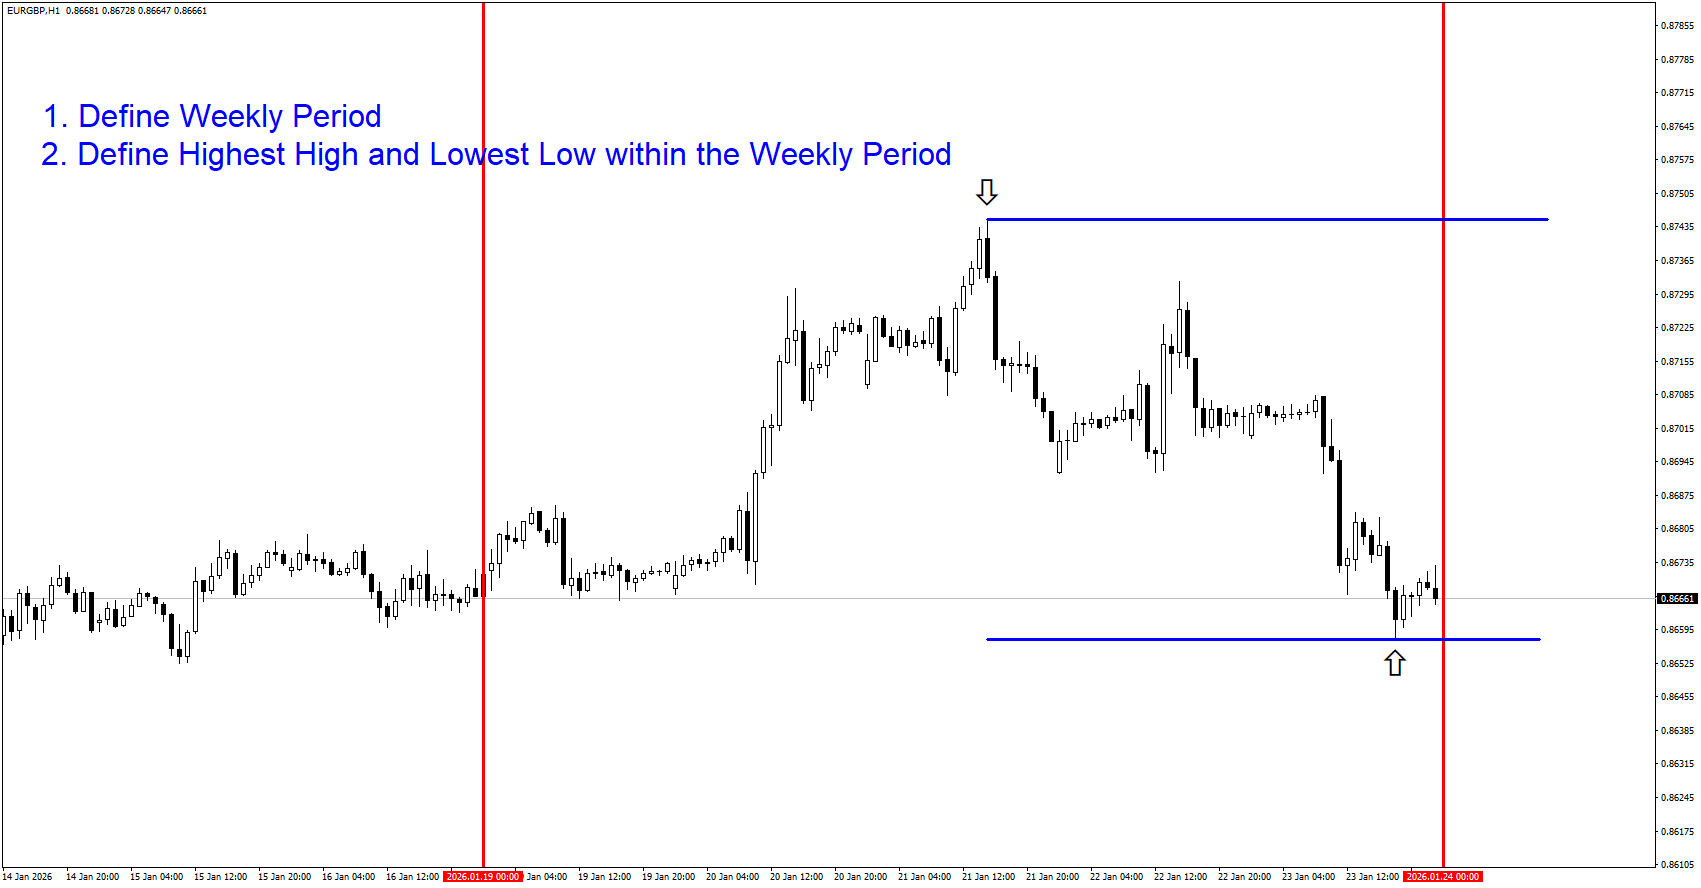
Step 2: Define the highest high and the lowest low within the weekly period
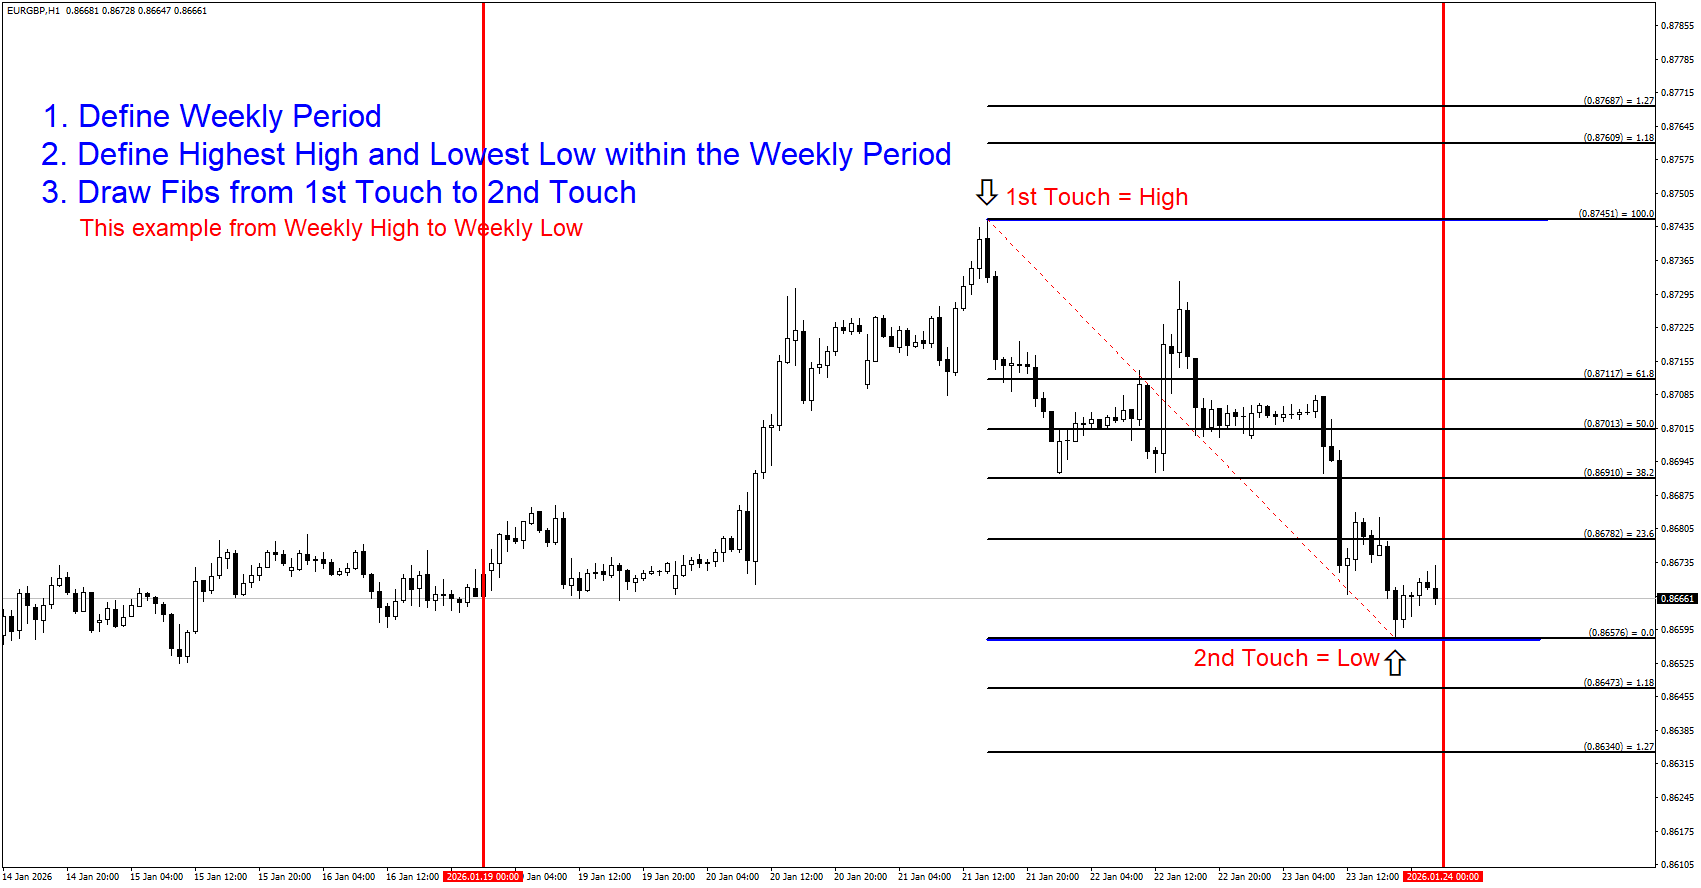
Step 3: After the period closes, Draw Fibs from 1st touch to 2nd touch starting from left to right.
(This example is from High to Low)
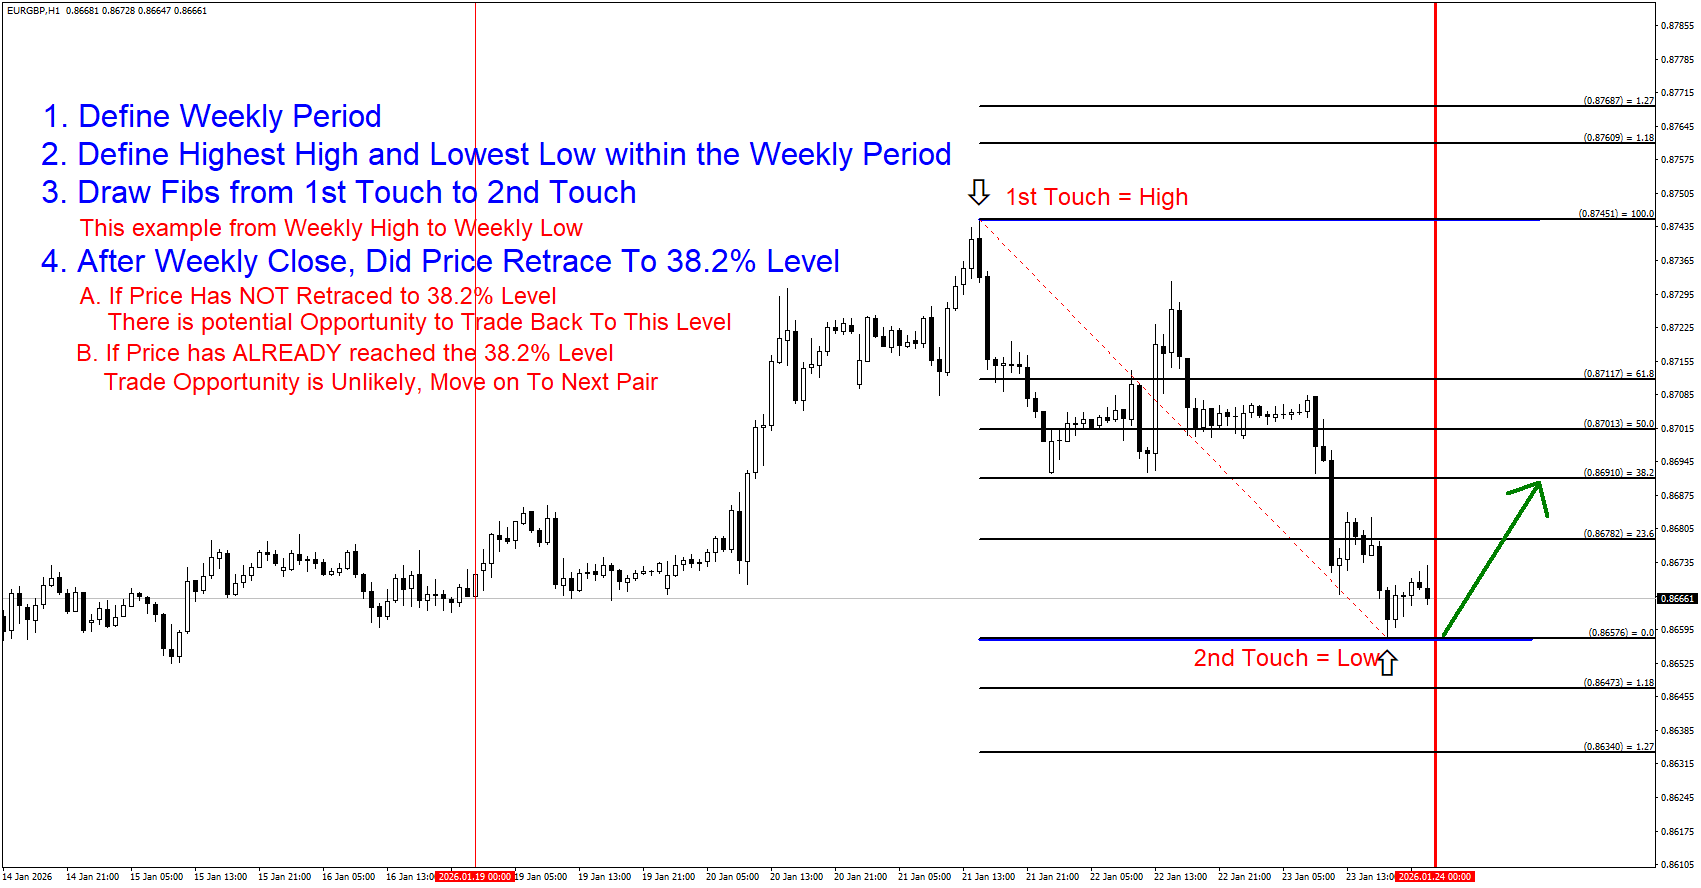
Step 4: Wait until after the weekly close, determine if price retraced to 38.2% Level or did it Not
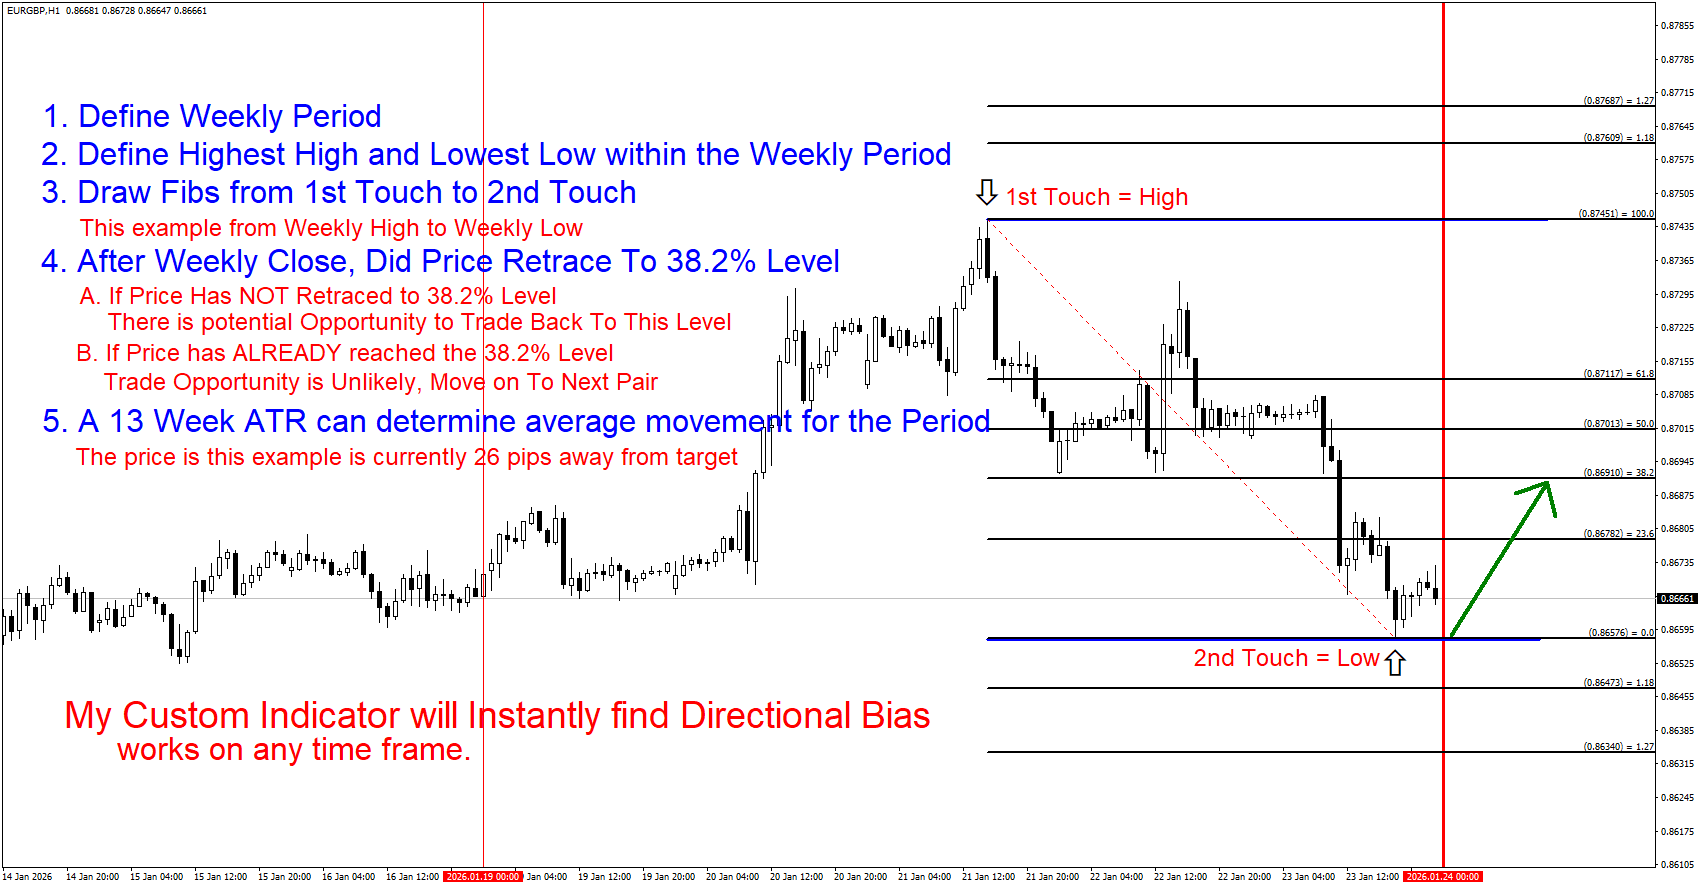
5. If price has retraced to the 38.2% Level, a trade opportunity is unlikely. May be best to move on to next pair,
to analyze for another opportunity elsewhere.
This strategy may present opportunities in multiple pairs each week.
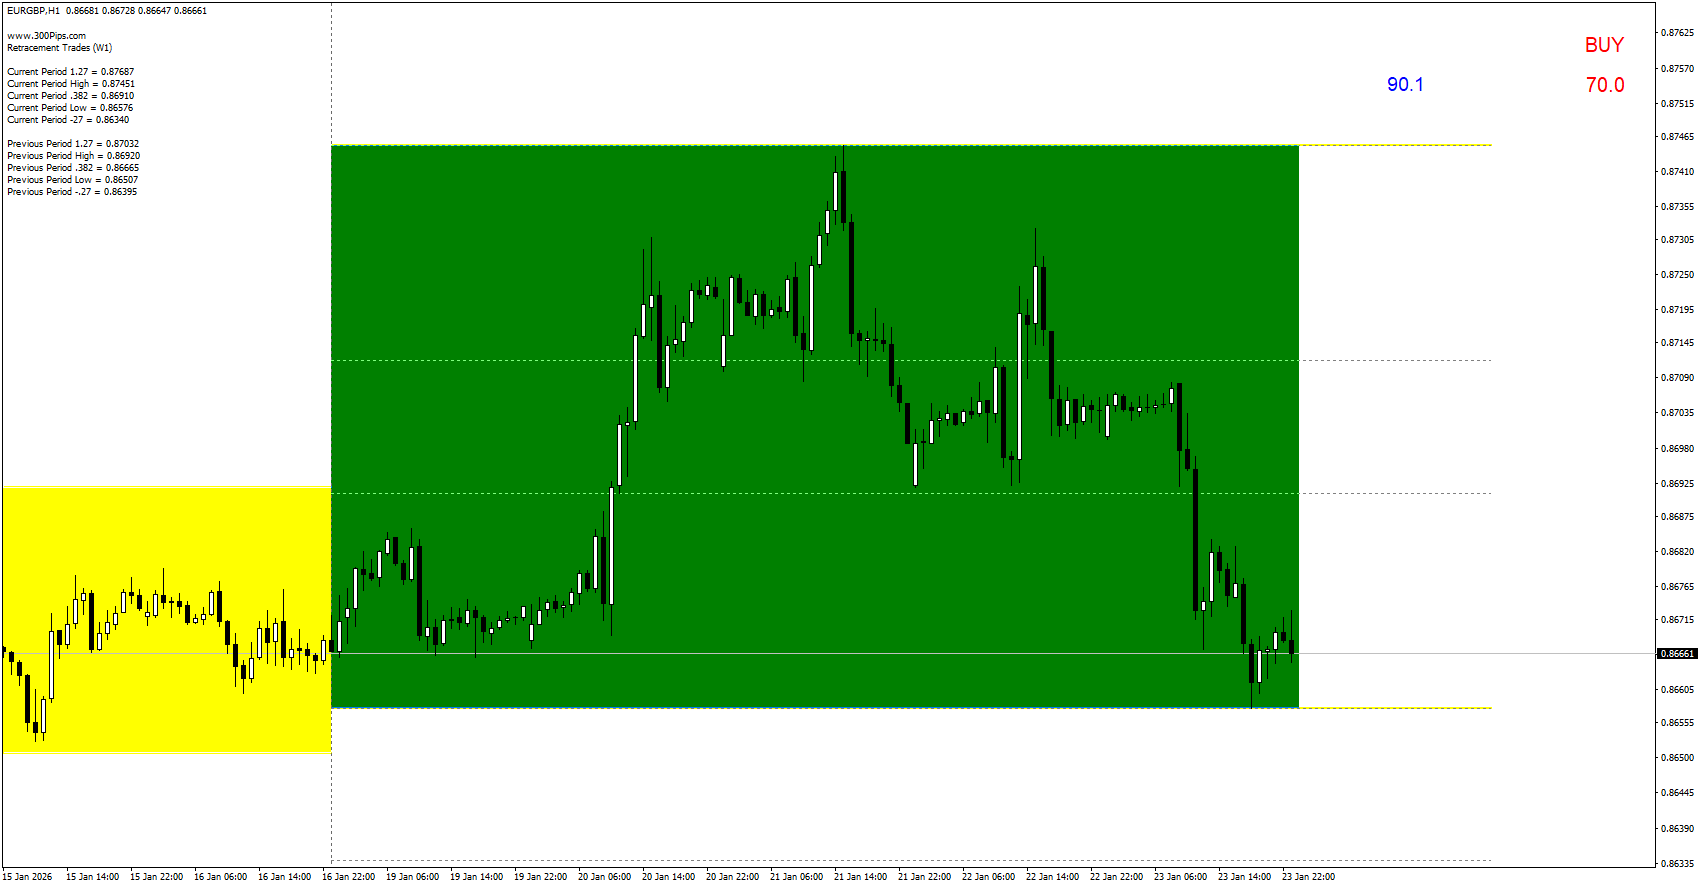
My Custom Indicator will Find Directional Bias Instantly
Displays Green Periods for potential Buys and Red Periods for potential Sells
300 Pips Pro Toolkit 300 Pips Market Bias Engine 300 Pips Precision Levels
© 2026 300Pips.com · Forex Trading Tools & Analytics